Picking Backup Climbs with 20 Years of Weather Data
You plan a route on Mount Shuksan for weeks, and three days out the forecast falls apart. Now what?
People who have climbed here for twenty years answer this from memory. Storm coming off the ocean? Go east of the crest. Marine layer? Head south. They have a mental database built from hundreds of weekends, some of them ruined.
I don’t have that database. I’ve been climbing in the Cascades for a few years, and when my primary objective gets stormed out, I have no honest basis for picking a backup. I could copy what more experienced friends do, but I wanted to actually understand it. I wanted an answer I could check against 20 years of records, not secondhand rules of thumb.
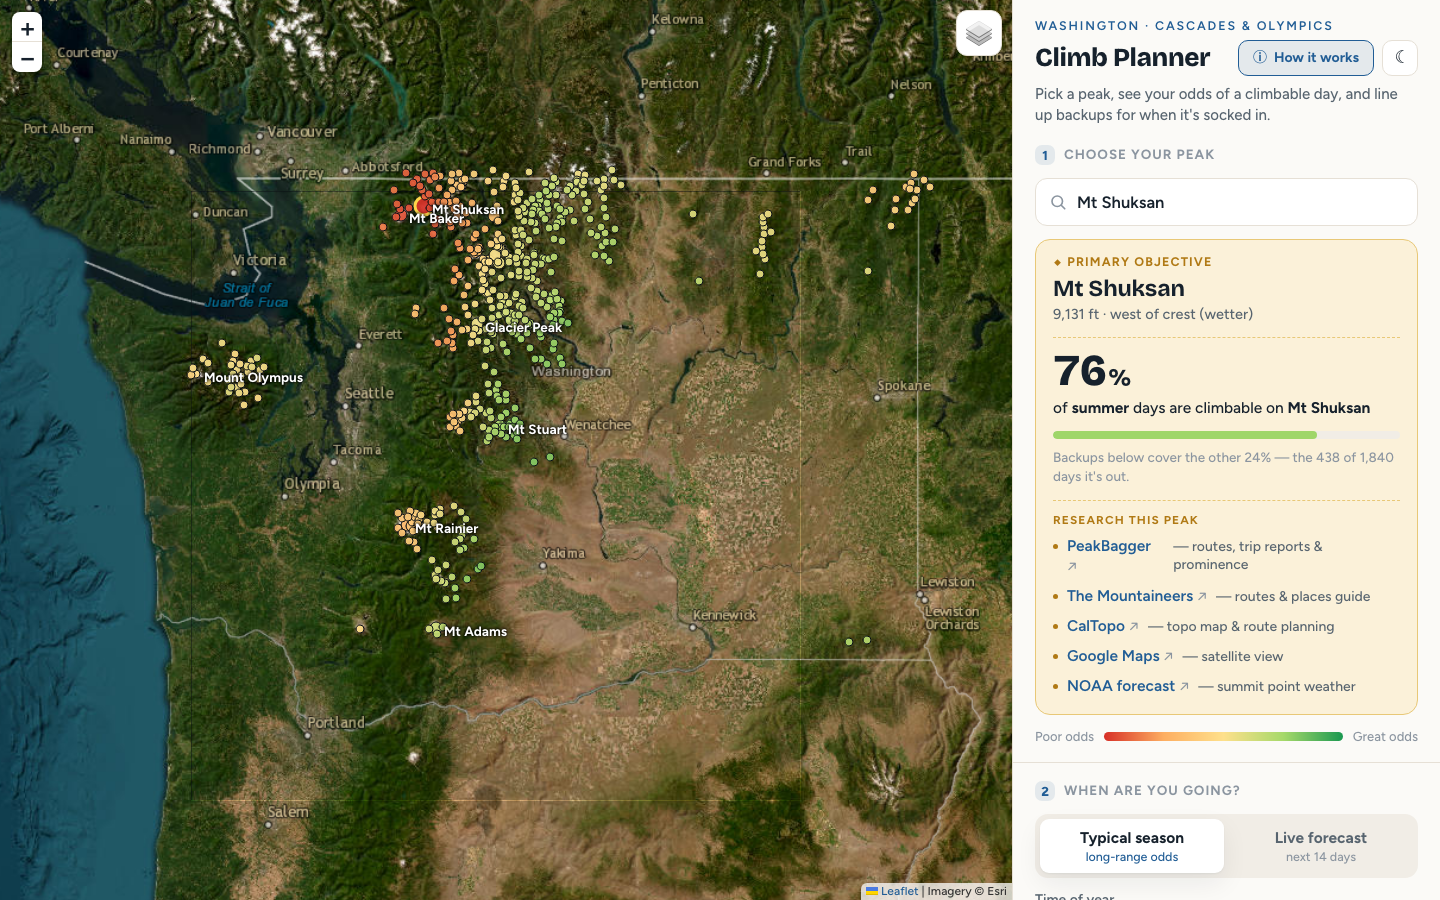
The result is the PNW Climb Planner, an interactive map that ranks backup objectives for any of 500 Washington peaks, conditioned on the season and the incoming weather pattern. This post is about how I got there.
Getting the data
I was experimenting with Claude Science at the time, so I asked it to do the data legwork. Two free, keyless sources cover everything:
- Daymet has daily precipitation, temperature, and snowpack on a 1 km grid going back decades. Sampled at each of 500 summits for 2004 through 2023, that’s about 7,300 days per peak.
- NASA POWER has daily wind direction, pulled at five points spanning coast to dry interior to label each day’s flow pattern.
The peak list is the Bulger List of the 100 highest Washington peaks, plus 400 more from OpenStreetMap so the Olympics, both sides of the Cascades, and the Blue Mountains are all represented.
Then I needed a definition of a “climbable day.” I settled on 3 mm of precipitation or less and an overnight low of -15 °C or warmer. It’s a deliberately simple proxy for “dry and not brutally cold.” A rock climber and an ice climber would draw those lines differently, and that’s fine. The point is to compare peaks against each other, and any reasonable threshold preserves the ranking.
What the data said
Four things stood out.
The rain shadow is enormous. Mount Baker averages over 200 inches of precipitation a year. Peaks 50 miles east in the Methow see under 30. That’s a 7x gradient across a two-hour drive, and it’s the physical foundation of every backup plan in this state.
There is no anti-correlated peak. I assumed some peaks would be good exactly when others are bad. The data says no. Washington storms are big; when one moves in, nearly every pair of peaks gets wet together and dries out together. So when your objective is stormed out, everything is somewhat worse. The realistic goal is the peak that degrades least. On a wet southwest storm day, the far-eastern dry country still offers about a 50% chance of a climbable day while the western peaks sit near zero.
Winter breaks the strategy. Storms blanket the entire state, so hopping to a backup buys you little. It’s in summer that the dry east genuinely decouples from the wet west, which means the approach pays off most exactly during climbing season. Convenient.
The best backup flips with the weather pattern. This is the one I didn’t expect. Classifying all 7,300 days by their statewide precipitation shape and wind direction produced five recurring patterns. On a wet southwest day, the best backup for a stormed-out Shuksan is east; on a dry northwest day, it’s south. The direction depends on the pattern, not the peak.
From report to planner
The first output was a report with static charts. It answered my questions, but every chart provoked a new one. What about this peak? What about September? What if the incoming pattern is transitional instead of a full storm?
A static report can’t answer follow-up questions. An interactive map can. So I turned the report into the planner: pick any peak, pick a season or let the live 14-day forecast classify the incoming pattern, and it ranks your Plan B and Plan C by their odds on exactly the days your first choice was out. When you select a pattern, animated wind streaks show the flow so the geography clicks.
A concrete example. Shuksan in summer under a wet southwest storm drops to a 9% chance of a climbable day. The planner’s top backups for those exact days: Tatoosh Buttes (54%), Muckamuck Mountain (54%), and Ptarmigan Peak (51%), all far east of the crest. Under the dry northwest pattern the same Shuksan sits at 91% and the whole question evaporates.
Under the hood it’s a single static page: vanilla JS, Leaflet, a bit-packed binary of 500 x 7,300 climbable-day flags (456 KB), and Open-Meteo for the live forecast. The forecast classifier is nearest-centroid over four features. It reproduces the historical patterns about 70% of the time (random guessing over five patterns would get 20%), and about 87% on the wet-vs-dry call that actually drives decisions.
The full write-up with figures and method is in the report (PDF). The app code, figures, and the 500-peak roster are in the project folder of this site’s repo.
What it won’t tell you
This is a planning aid built on historical weather. It is not a forecast for your climb day, and it knows nothing about avalanche hazard, route conditions, rockfall, smoke, or whether the road is open. A peak with great weather odds can still be dangerous. Check a real mountain forecast and the NWAC bulletin before committing to anything.
Try it
The planner is at dreamiurg.net/pnw-climb-planner.html. If you climb in Washington, I’d genuinely like to know whether the rankings match your experience, especially if you’re one of those people with the twenty-year mental database. And if you have ideas for improvements, drop me a line.
Comments